
Crowd Intelligence turns the raw conversations happening across Reddit into a live picture of your audience: what they care about, how they feel, the words they use, and what is changing. This is the complete walkthrough. It covers how the system works, how to get set up, and how to read every part of your dashboard, plus best practices, plan limits, and answers to common questions.
What you can do with Crowd Intelligence
At its core, Crowd Intelligence lets you:
Track what your audience is talking about across the subreddits that matter to you.
See how sentiment shifts over time, by topic, and by competitor.
Watch competitors and tools get discussed, and notice when that discussion moves.
Pull the exact words and phrases your audience uses into your own content.
Ask questions in plain English with the AI Analyst and get answers grounded in the current conversations.
How it works, in three steps
Under the hood, Crowd Intelligence runs a simple loop:
Setup. You tell us your niche, the subreddits to watch, and the topics and competitors to track. We build a dashboard tailored to your space.
Data gathering. We continuously collect and analyze the relevant Reddit threads and comments, classifying each one by topic and sentiment.
Analysis. Your dashboard distills all of it into metrics, charts and an AI Analyst you can question, so you can act on what your audience is saying.
Getting set up
Crowd Intelligence is a guided, done-for-you setup rather than a self-serve configuration. For the full checklist of what you need, see Crowd Intelligence Setup Requirements.
Subscription
An active Crowd Intelligence subscription is required. Your plan determines how many subreddits you can monitor and how much history you can analyze, covered under plan limits below.
The onboarding journey
Once you subscribe, onboarding runs in three short stages:
Complete the setup form (day 1). You describe your niche and share the subreddits, topics, competitors and keywords you want tracked.
Setup call (within 1 to 2 business days). We walk through your goals together and confirm exactly what your dashboard should monitor.
Dashboard creation (1 to 2 business days after the call). We build your dashboard and start the first data collection. You get a link as soon as it is live.
How data gathering works
Continuous collection
After your dashboard goes live, collection runs continuously in the background. We gather new threads and comments from your subreddits as they appear, so the dashboard reflects an up-to-date view of the conversation rather than a one-time snapshot.
Data processing
Every thread and comment is analyzed and classified: which of your topics it belongs to, which competitors it mentions, and whether its sentiment is positive, neutral, negative or mixed. That classification is what powers the charts and filters you see.
Data limits and retention
How many subreddits you can track and how far back your history goes depend on your plan. If a topic is broader than your plan covers, tightening your subreddit list or upgrading gives you fuller coverage. See plan limits below.
A tour of your dashboard
This is the heart of Crowd Intelligence. Every metric and chart below responds to the filters you have active (date range, keywords, topics, competitors and subreddits), so the same dashboard answers very different questions depending on the slice you choose. For a focused walkthrough of just the headline numbers, see Understanding your dashboard metrics.
The metrics bar
The row of tiles at the top is your at-a-glance summary of the current slice: total conversations, the split between threads and comments, how many distinct authors are involved, average upvotes, and the share of positive sentiment. Each tile shows how it has moved versus the previous period.

Filtering your view
The filter bar is how you turn the whole dashboard into an answer to a specific question. Set a date range and narrow by keyword, topic, competitor or subreddit, and every card below updates to match. Most cards are also clickable, so selecting a slice on one chart filters the rest.

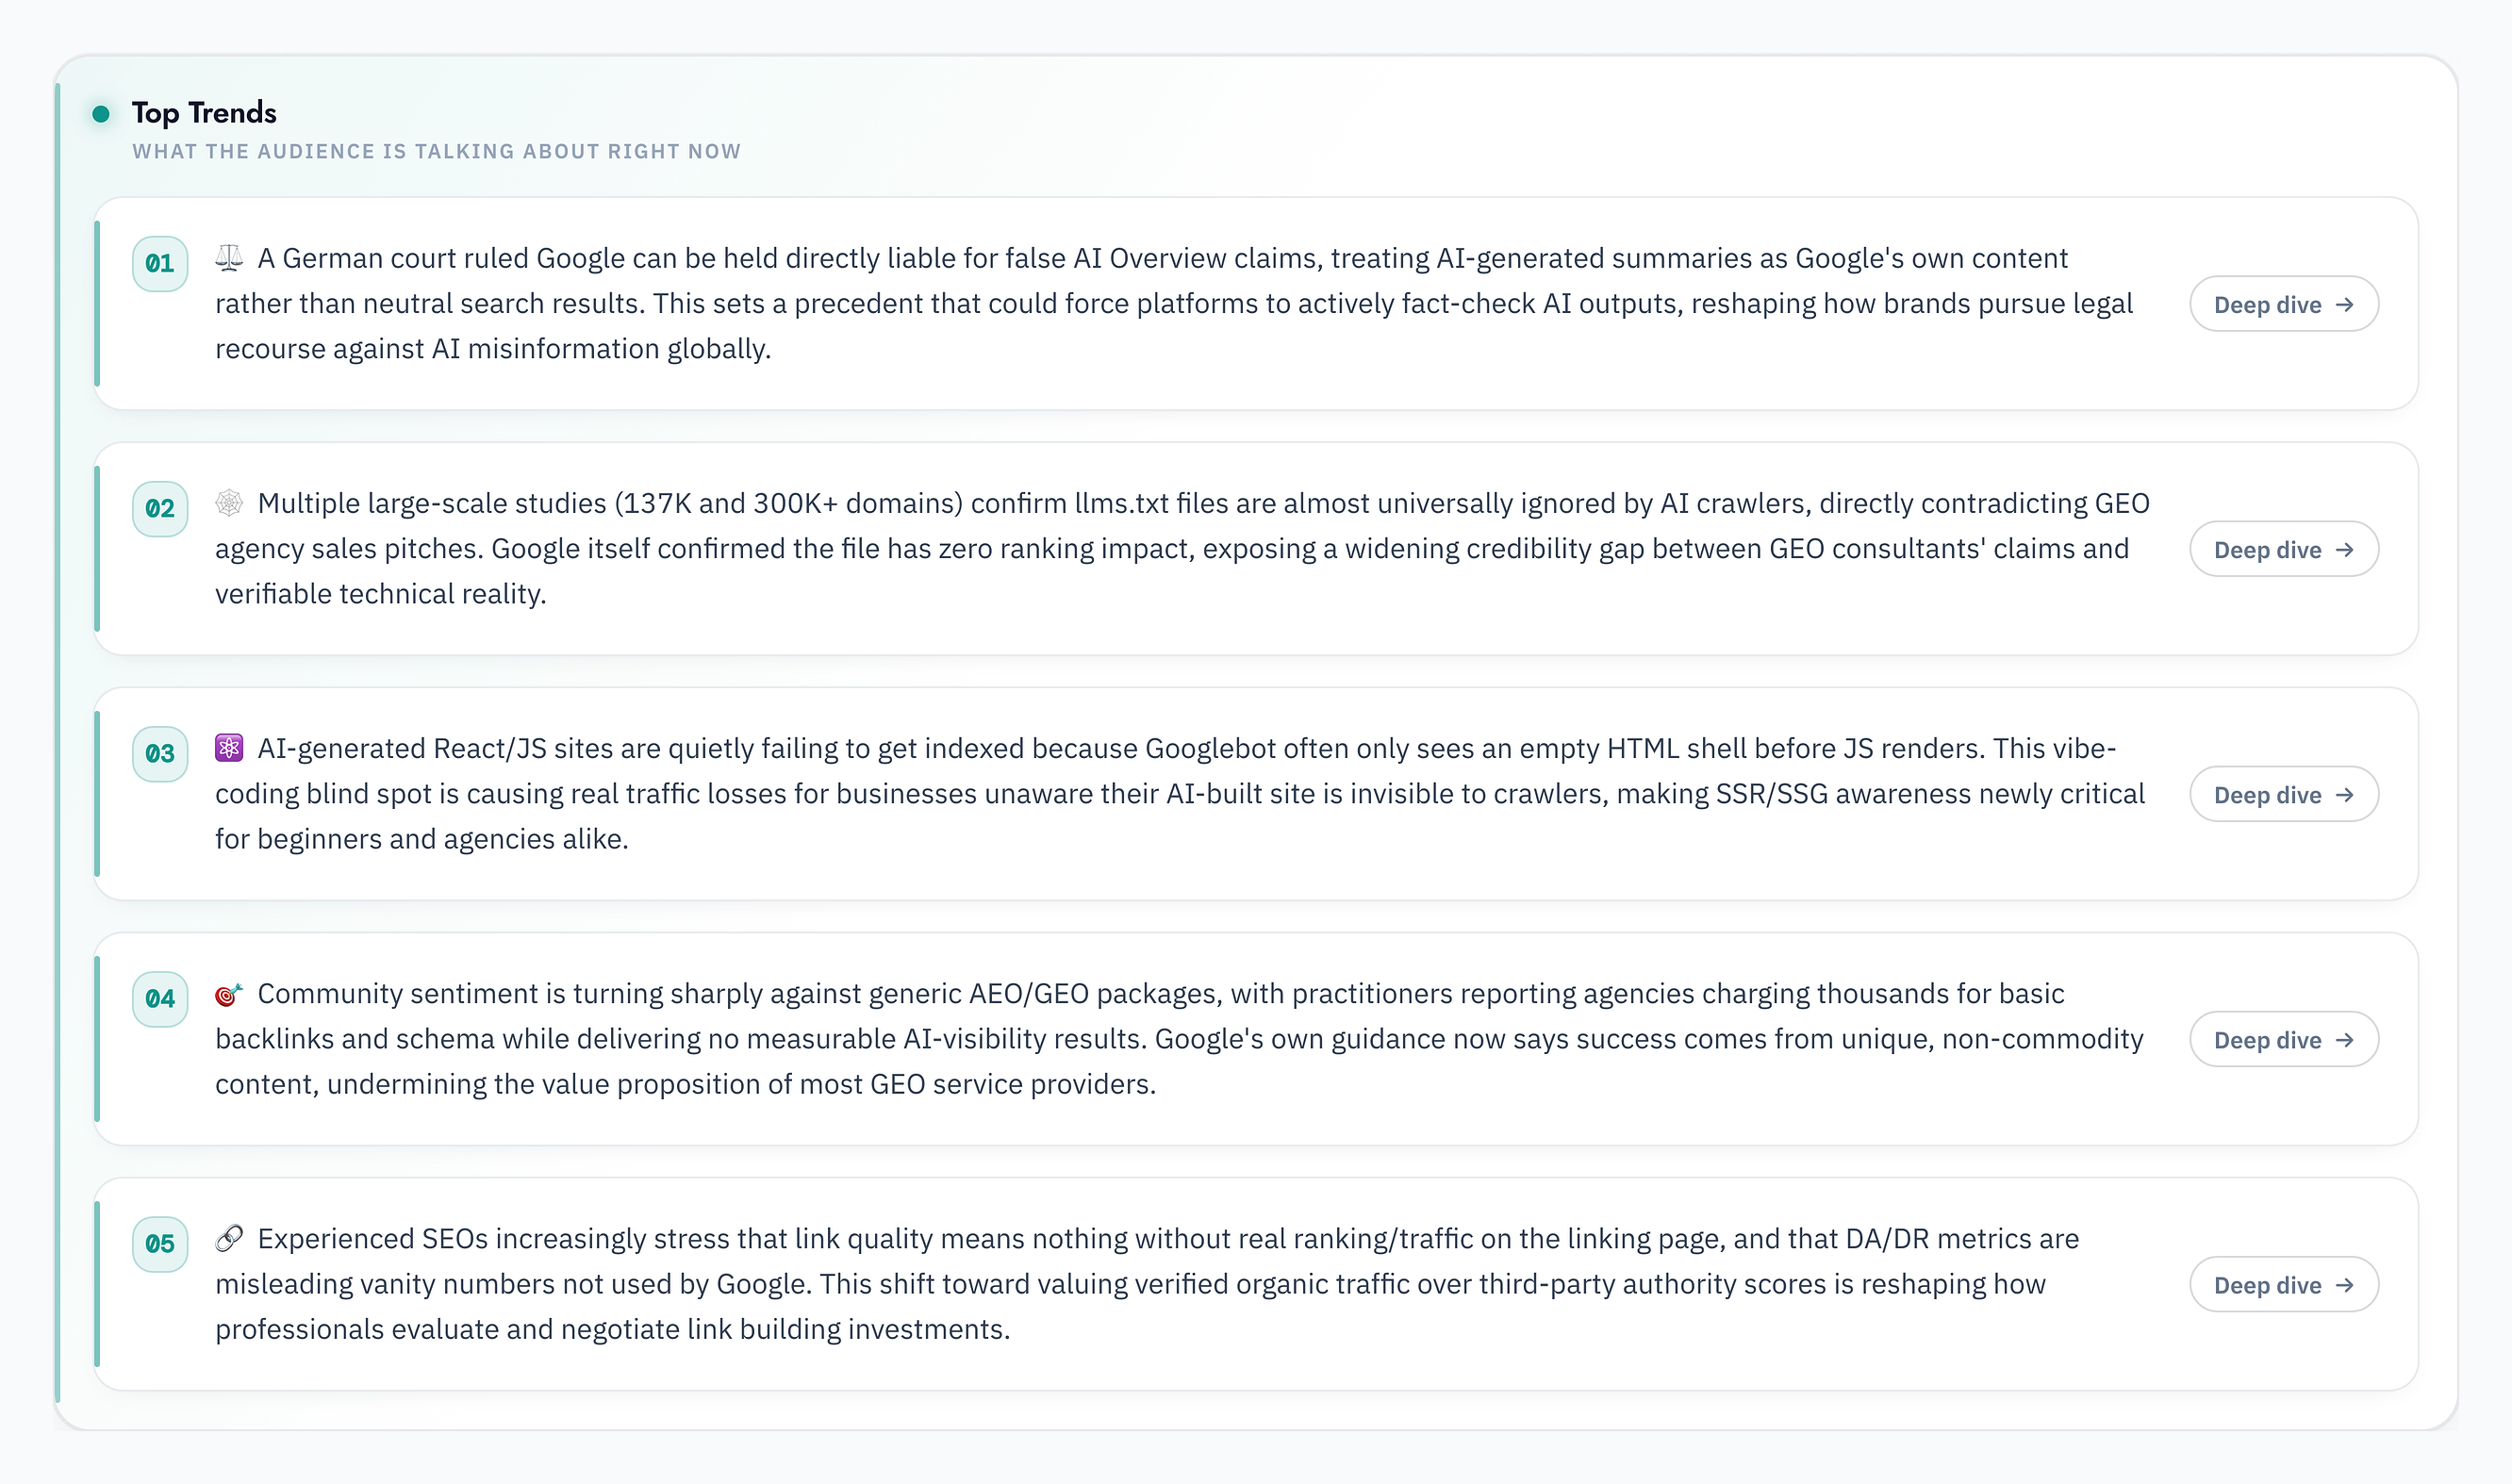
Top Trends
Top Trends is your dashboard reading itself. Our AI reviews every thread and comment in the current slice and surfaces the most important patterns as a short, ranked list. Each trend has a Deep dive button that opens the AI Analyst with the full story, example discussions and why it matters.
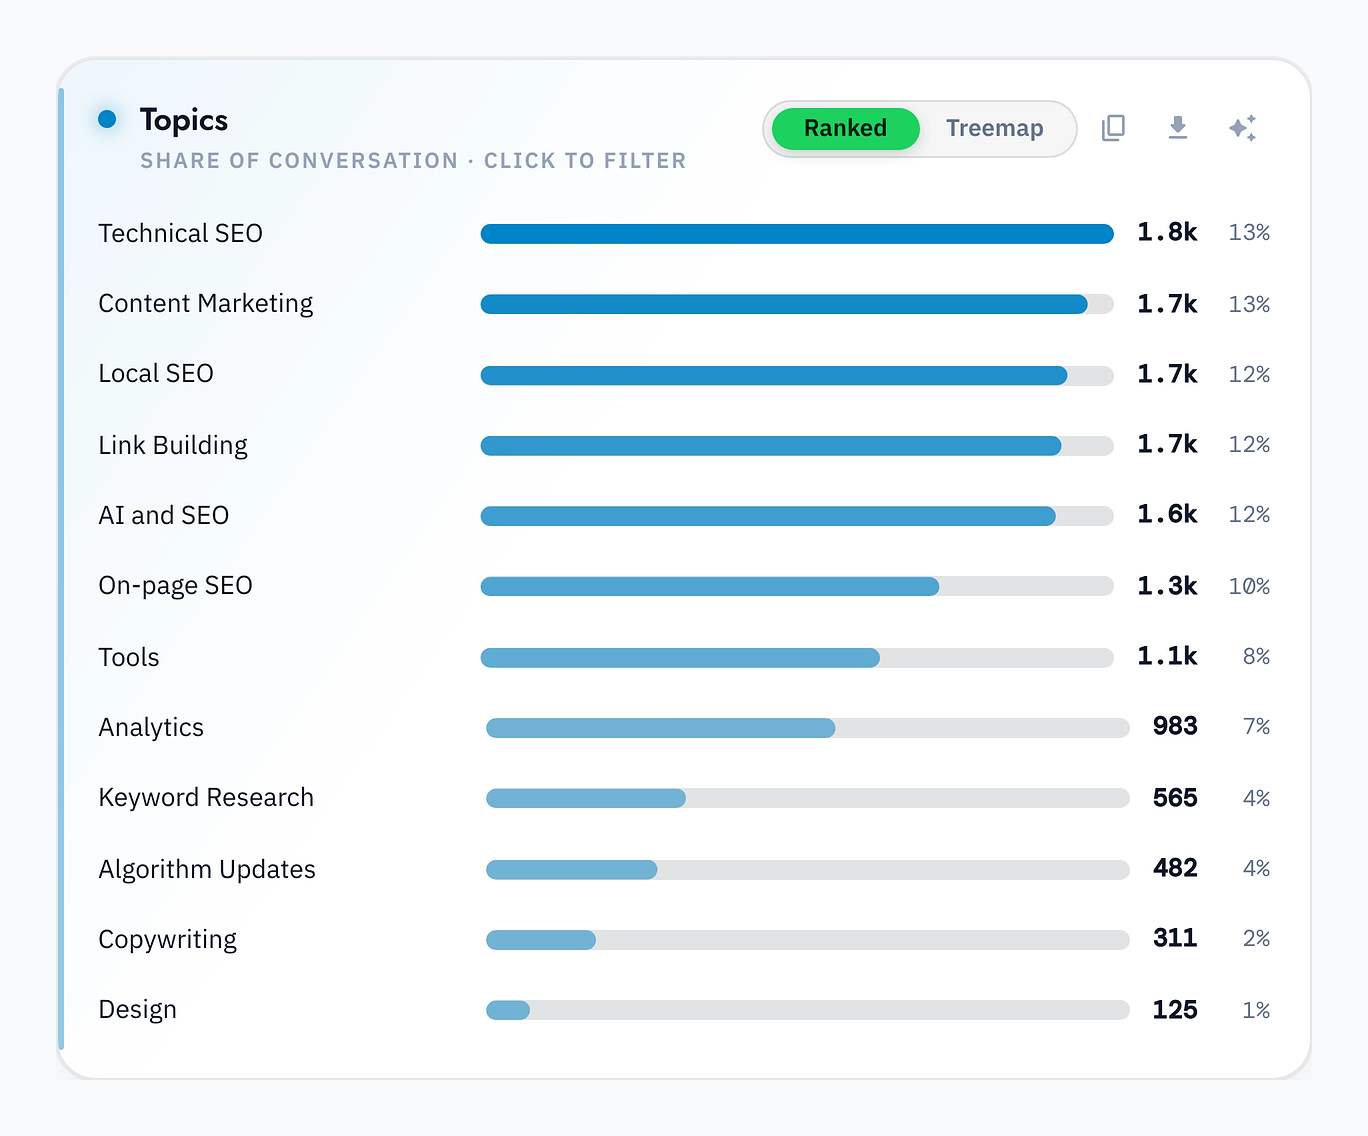
Topics
The Topics card ranks the subjects you defined during setup by share of conversation, so you can see what dominates your niche right now. Switch to the treemap view for a proportional layout, or click a topic to filter everything else to it.
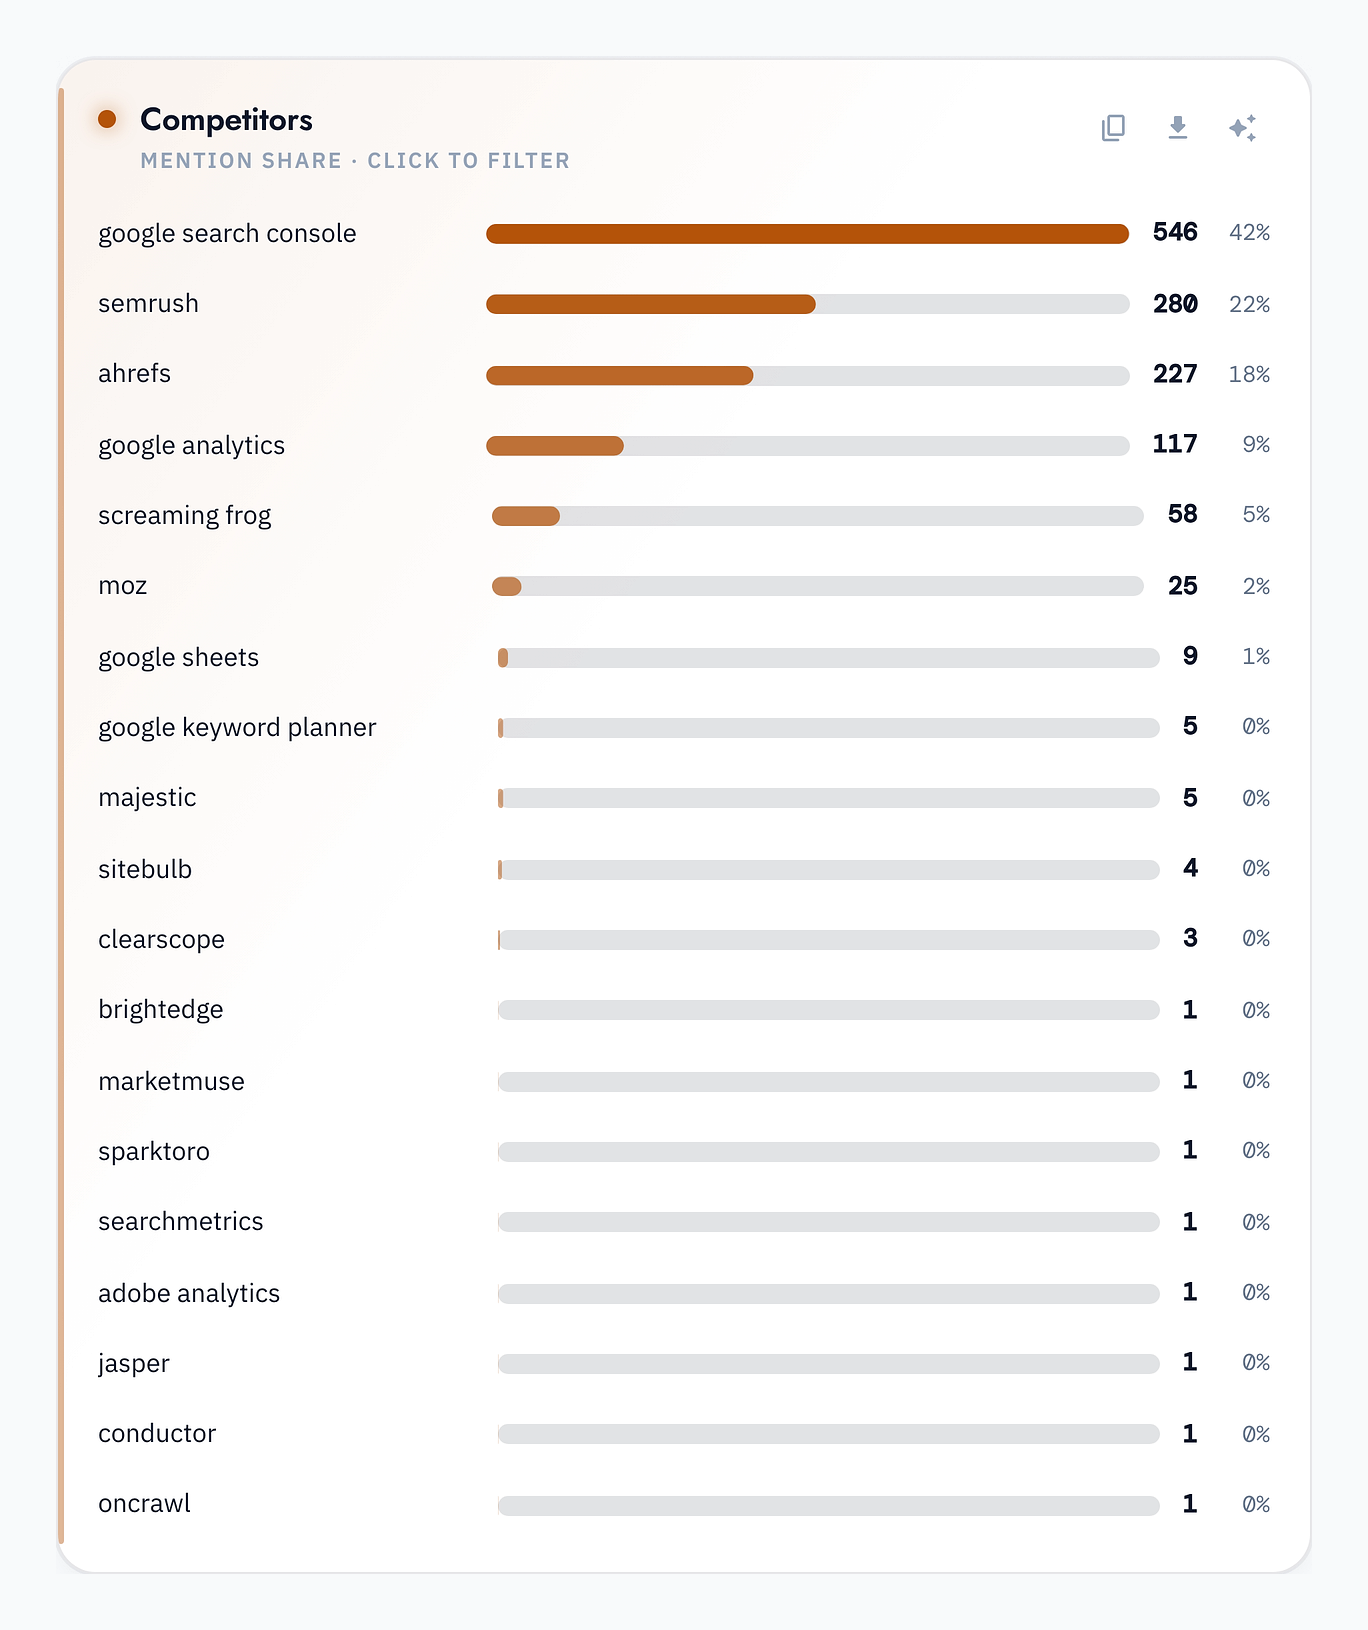
Competitors and tools
The Competitors card ranks how often each competitor or tool you track comes up. It is the fastest way to see who owns the conversation in your space and where you have room to show up more.
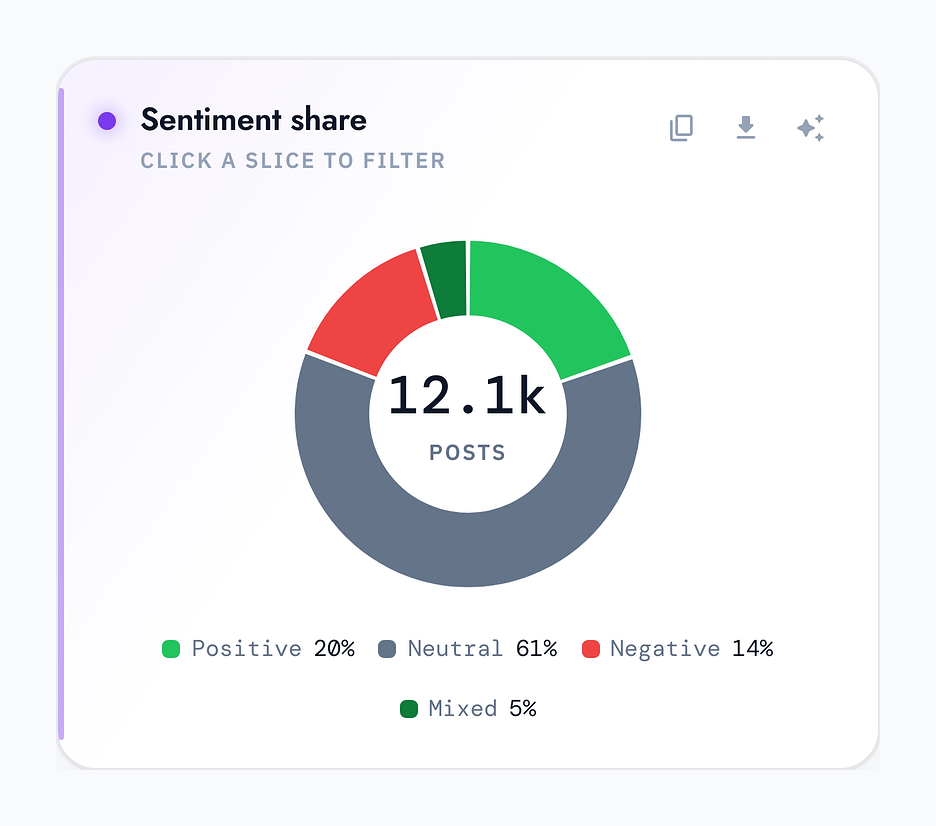
Sentiment
The Sentiment share donut shows how your audience feels about the filtered conversations: the balance of positive, neutral, negative and mixed posts, with the total in the center. Click any slice to filter the whole dashboard to just that mood.
Sentiment over time
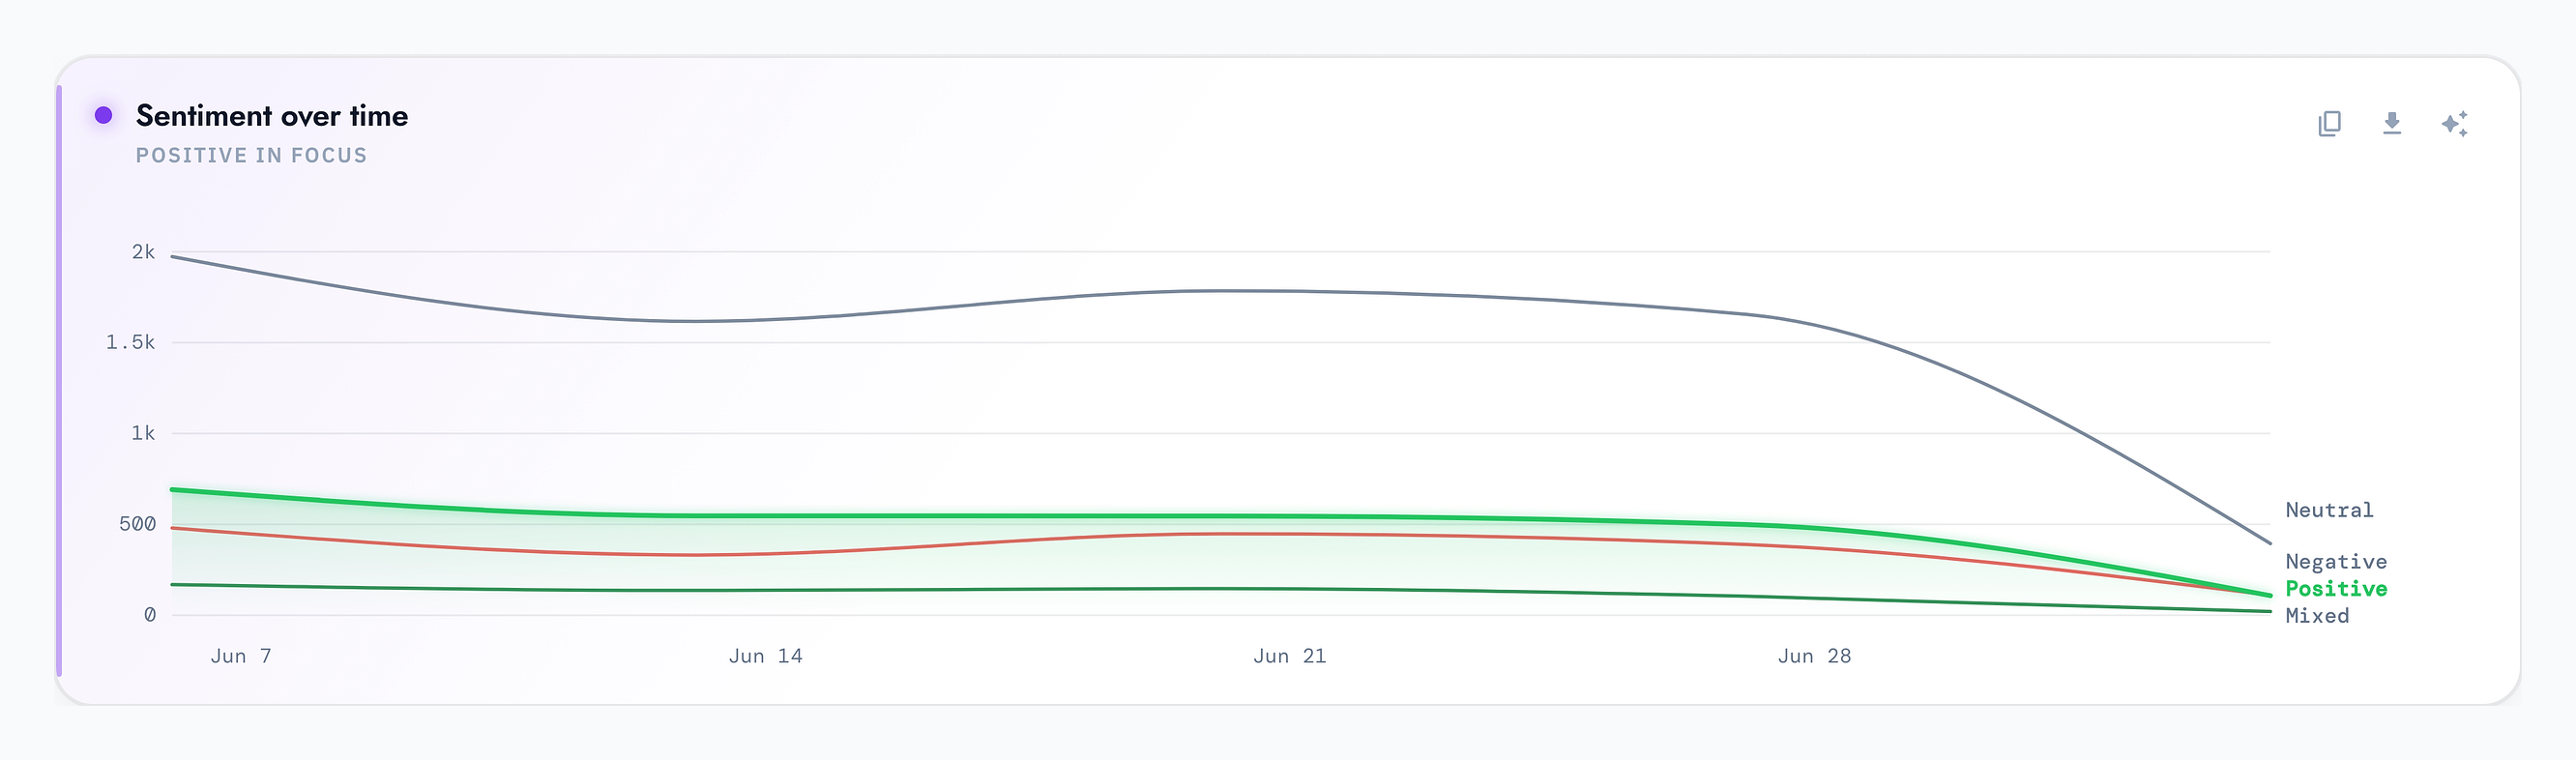
Where the donut is a snapshot, Sentiment over time is the trend. It plots how the mix of positive, neutral and negative conversation shifts across your selected period, so you can catch a rising problem or a warming reception early.
The language they use
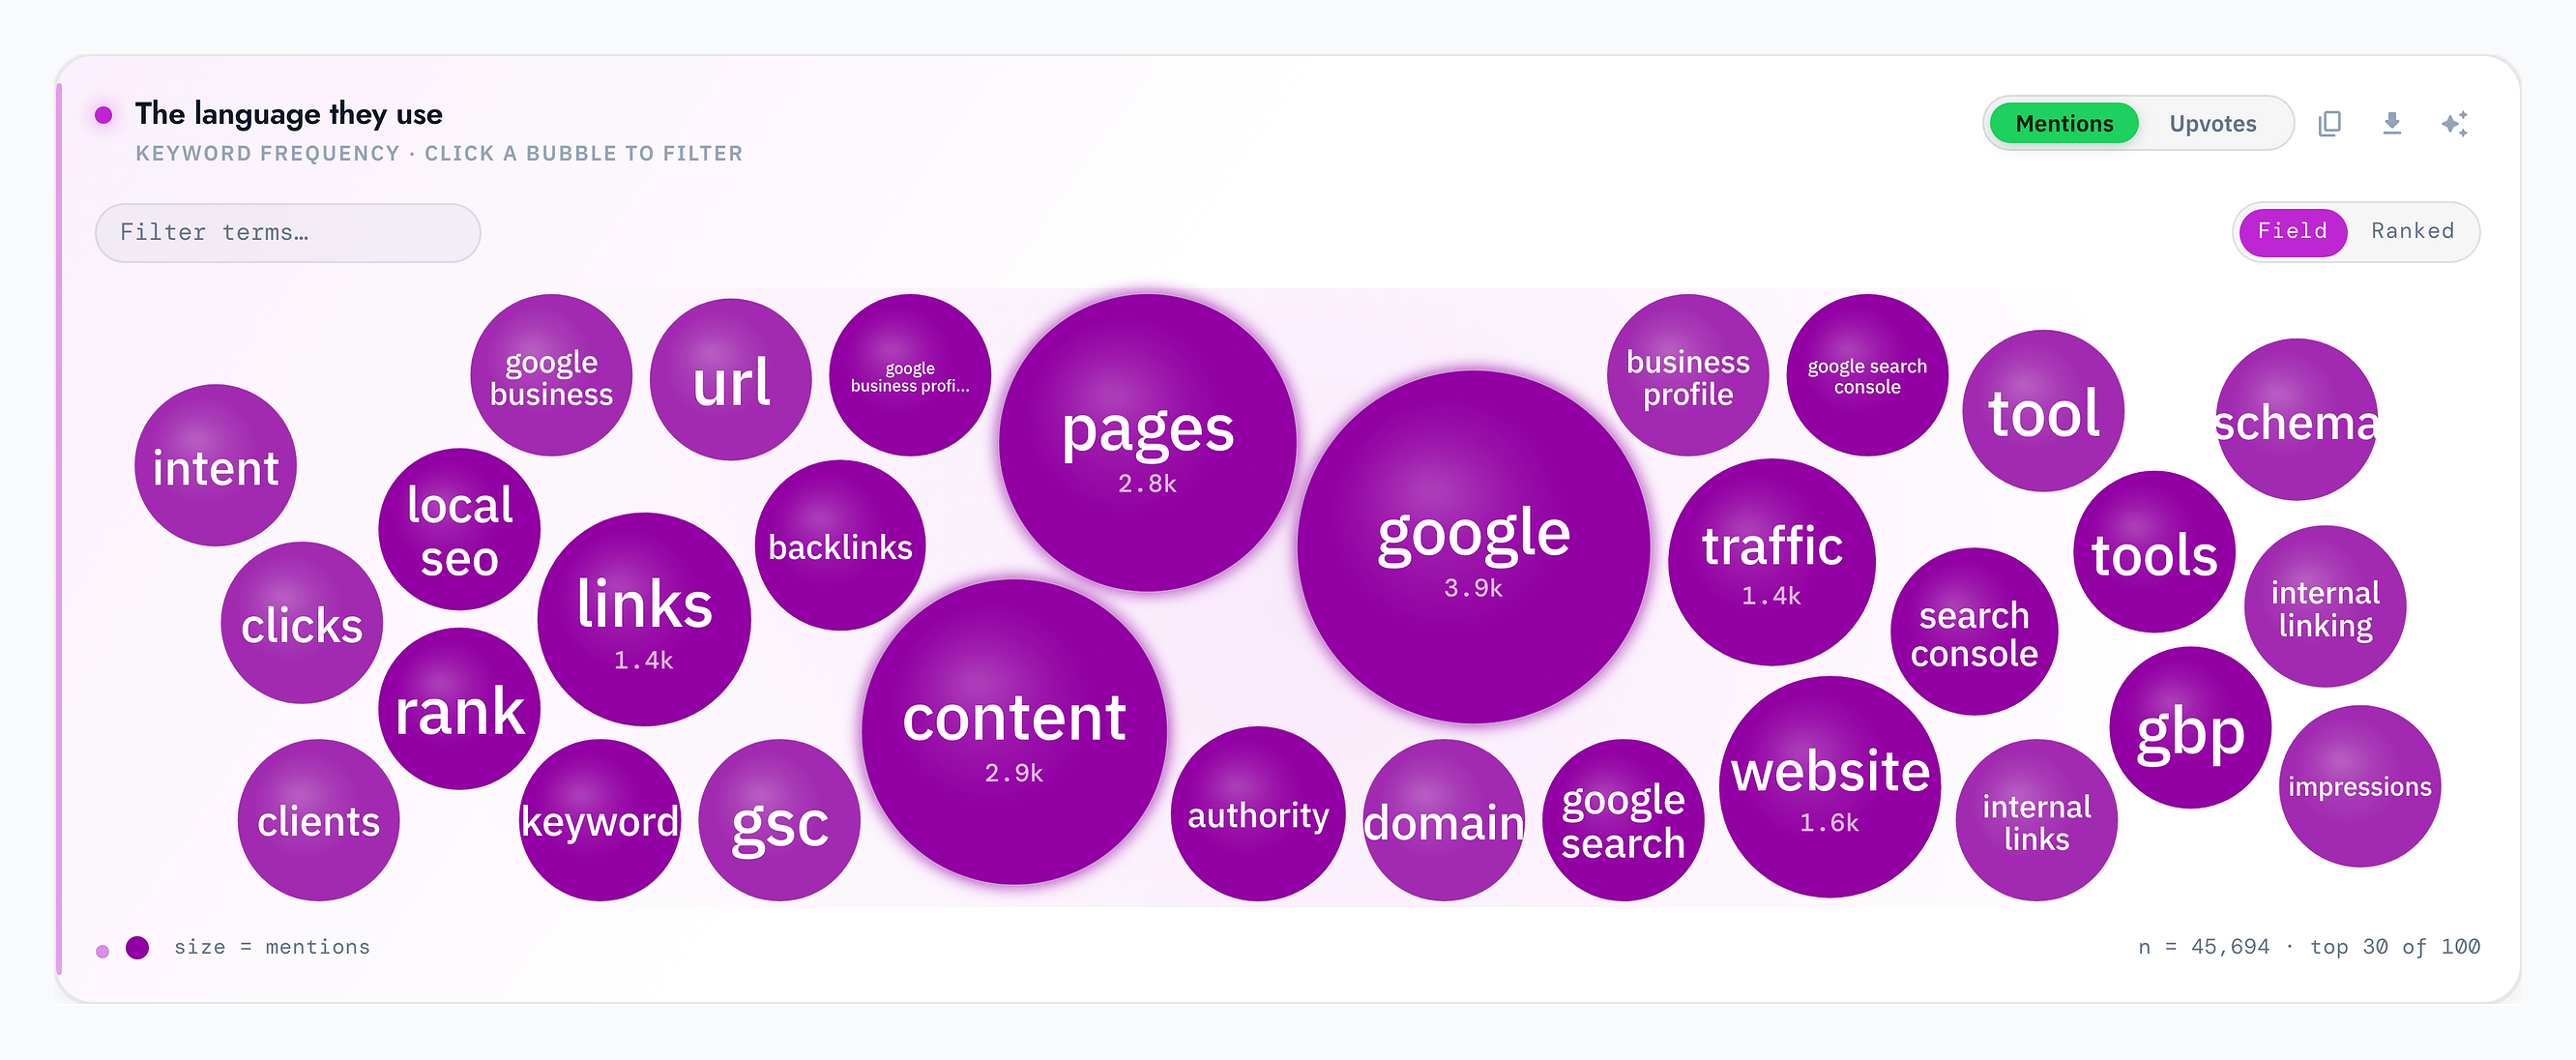
This word cloud captures the actual words and phrases your audience uses most. The bigger the bubble, the more often it comes up. It is the fastest way to pick up the vocabulary that resonates and work it into your own content.
Movers: what's rising and falling
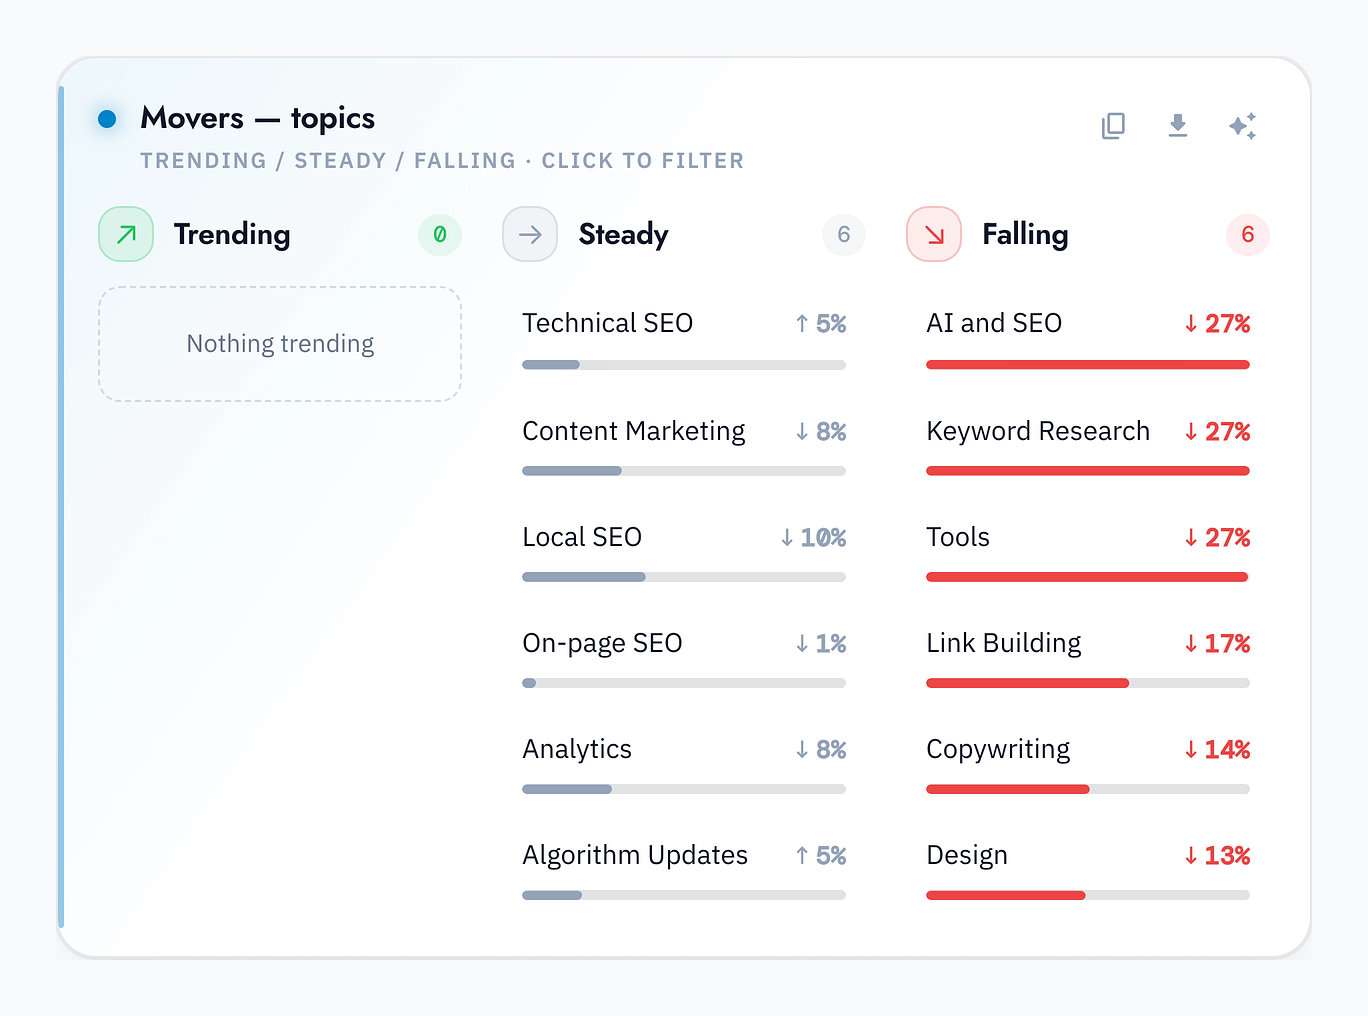
Movers compares this period with the last and sorts your topics and competitors into Trending, Steady and Falling, with the percentage change for each. Think of it as an early warning system for shifts in what your audience cares about.
Top threads
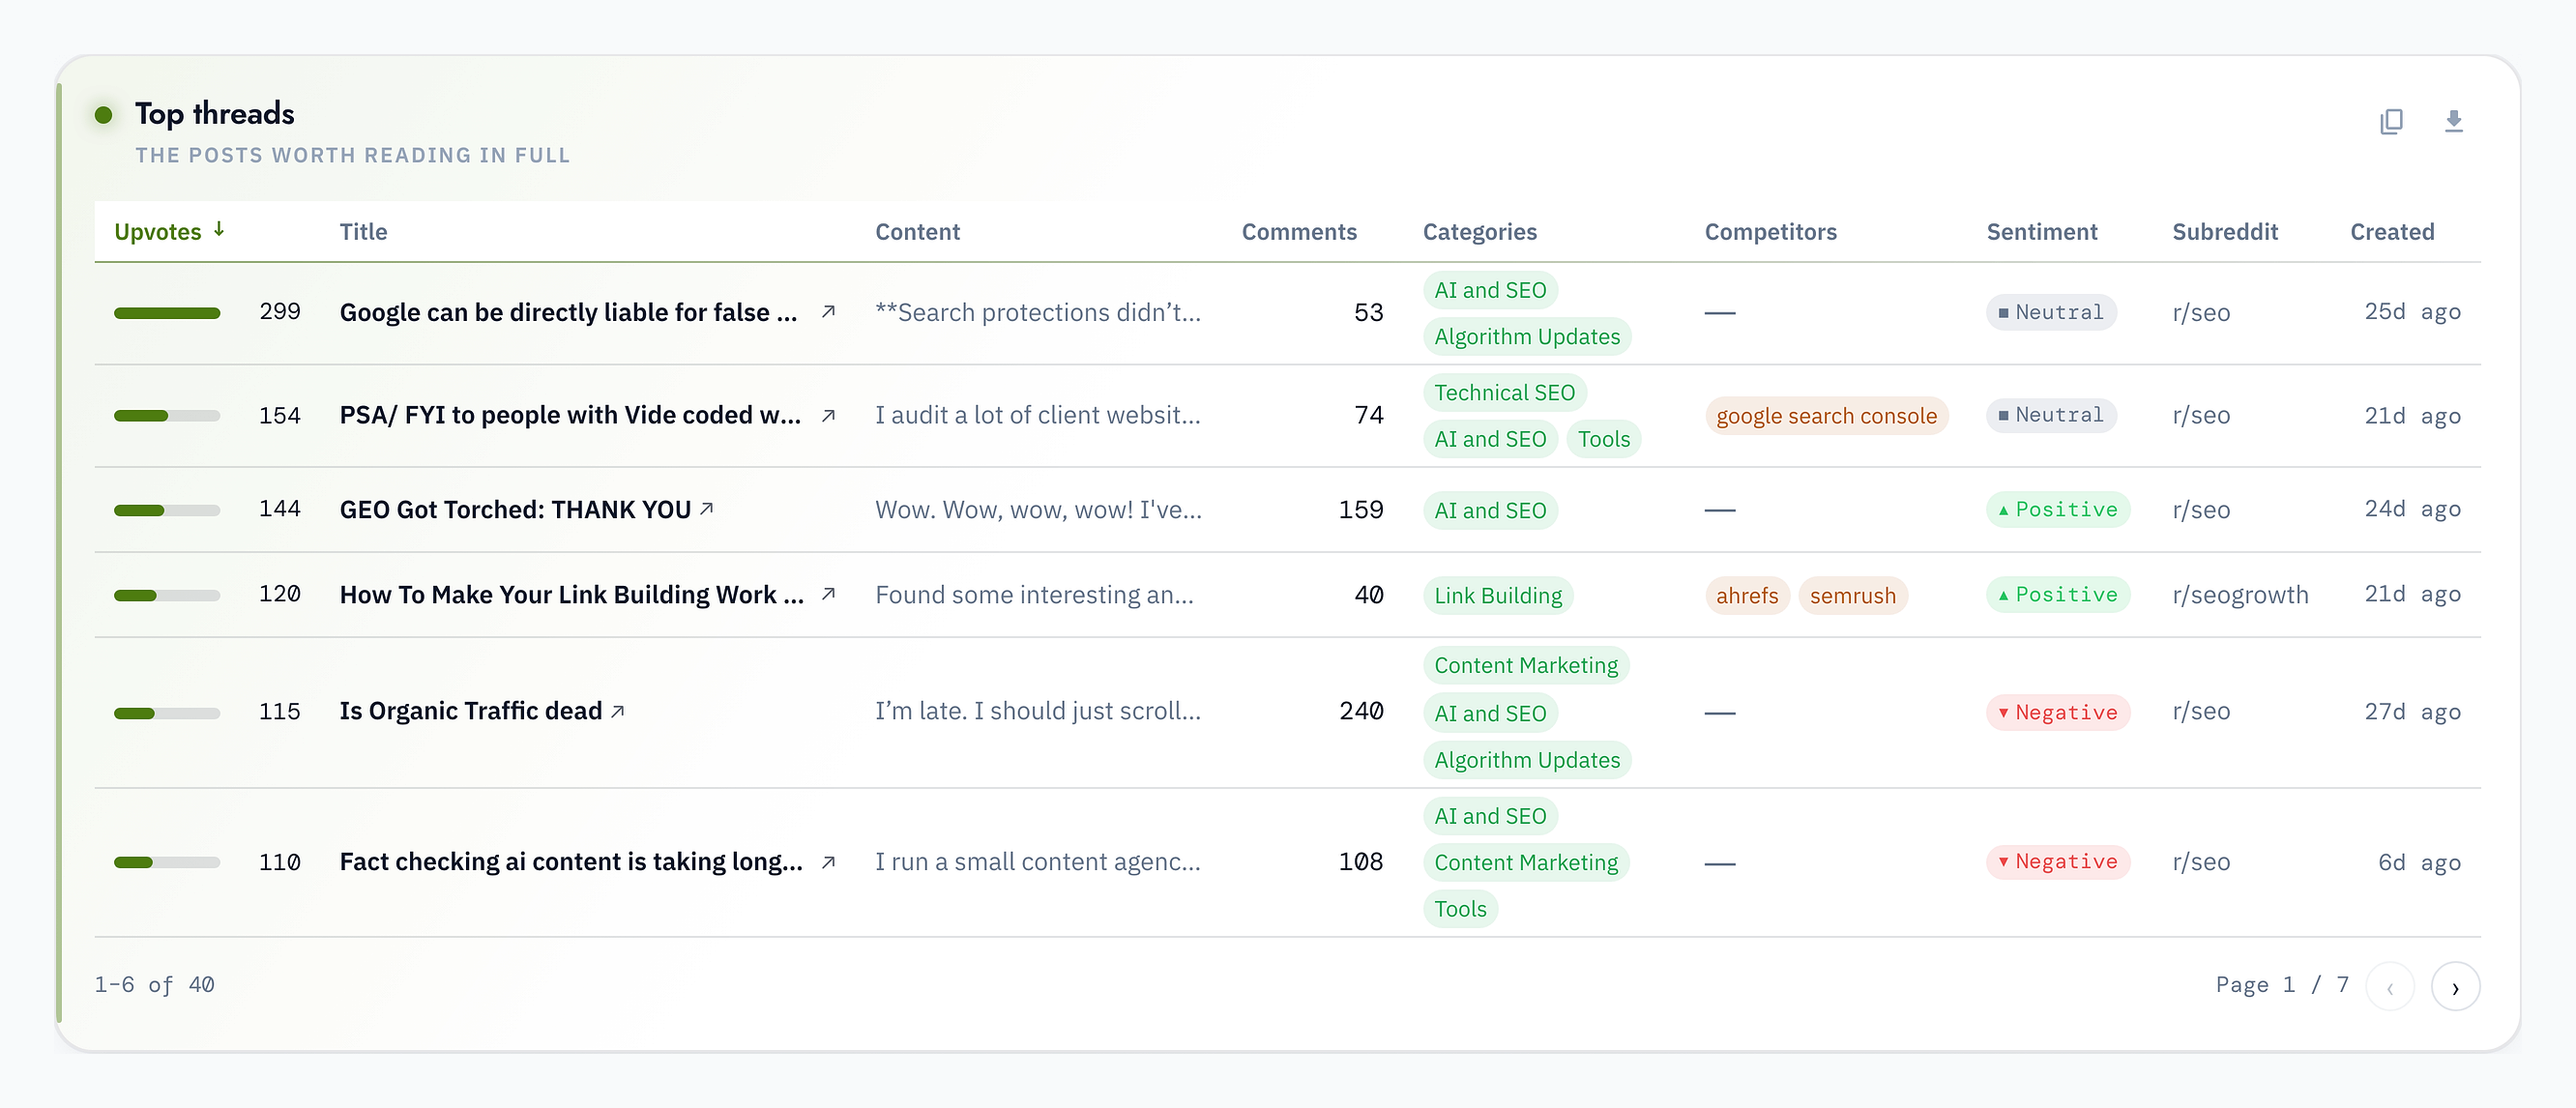
The Top threads table lists the highest-signal Reddit posts in your current slice, with the author, subreddit, score and sentiment for each. It is where you go from the numbers to the actual discussions worth reading and joining.
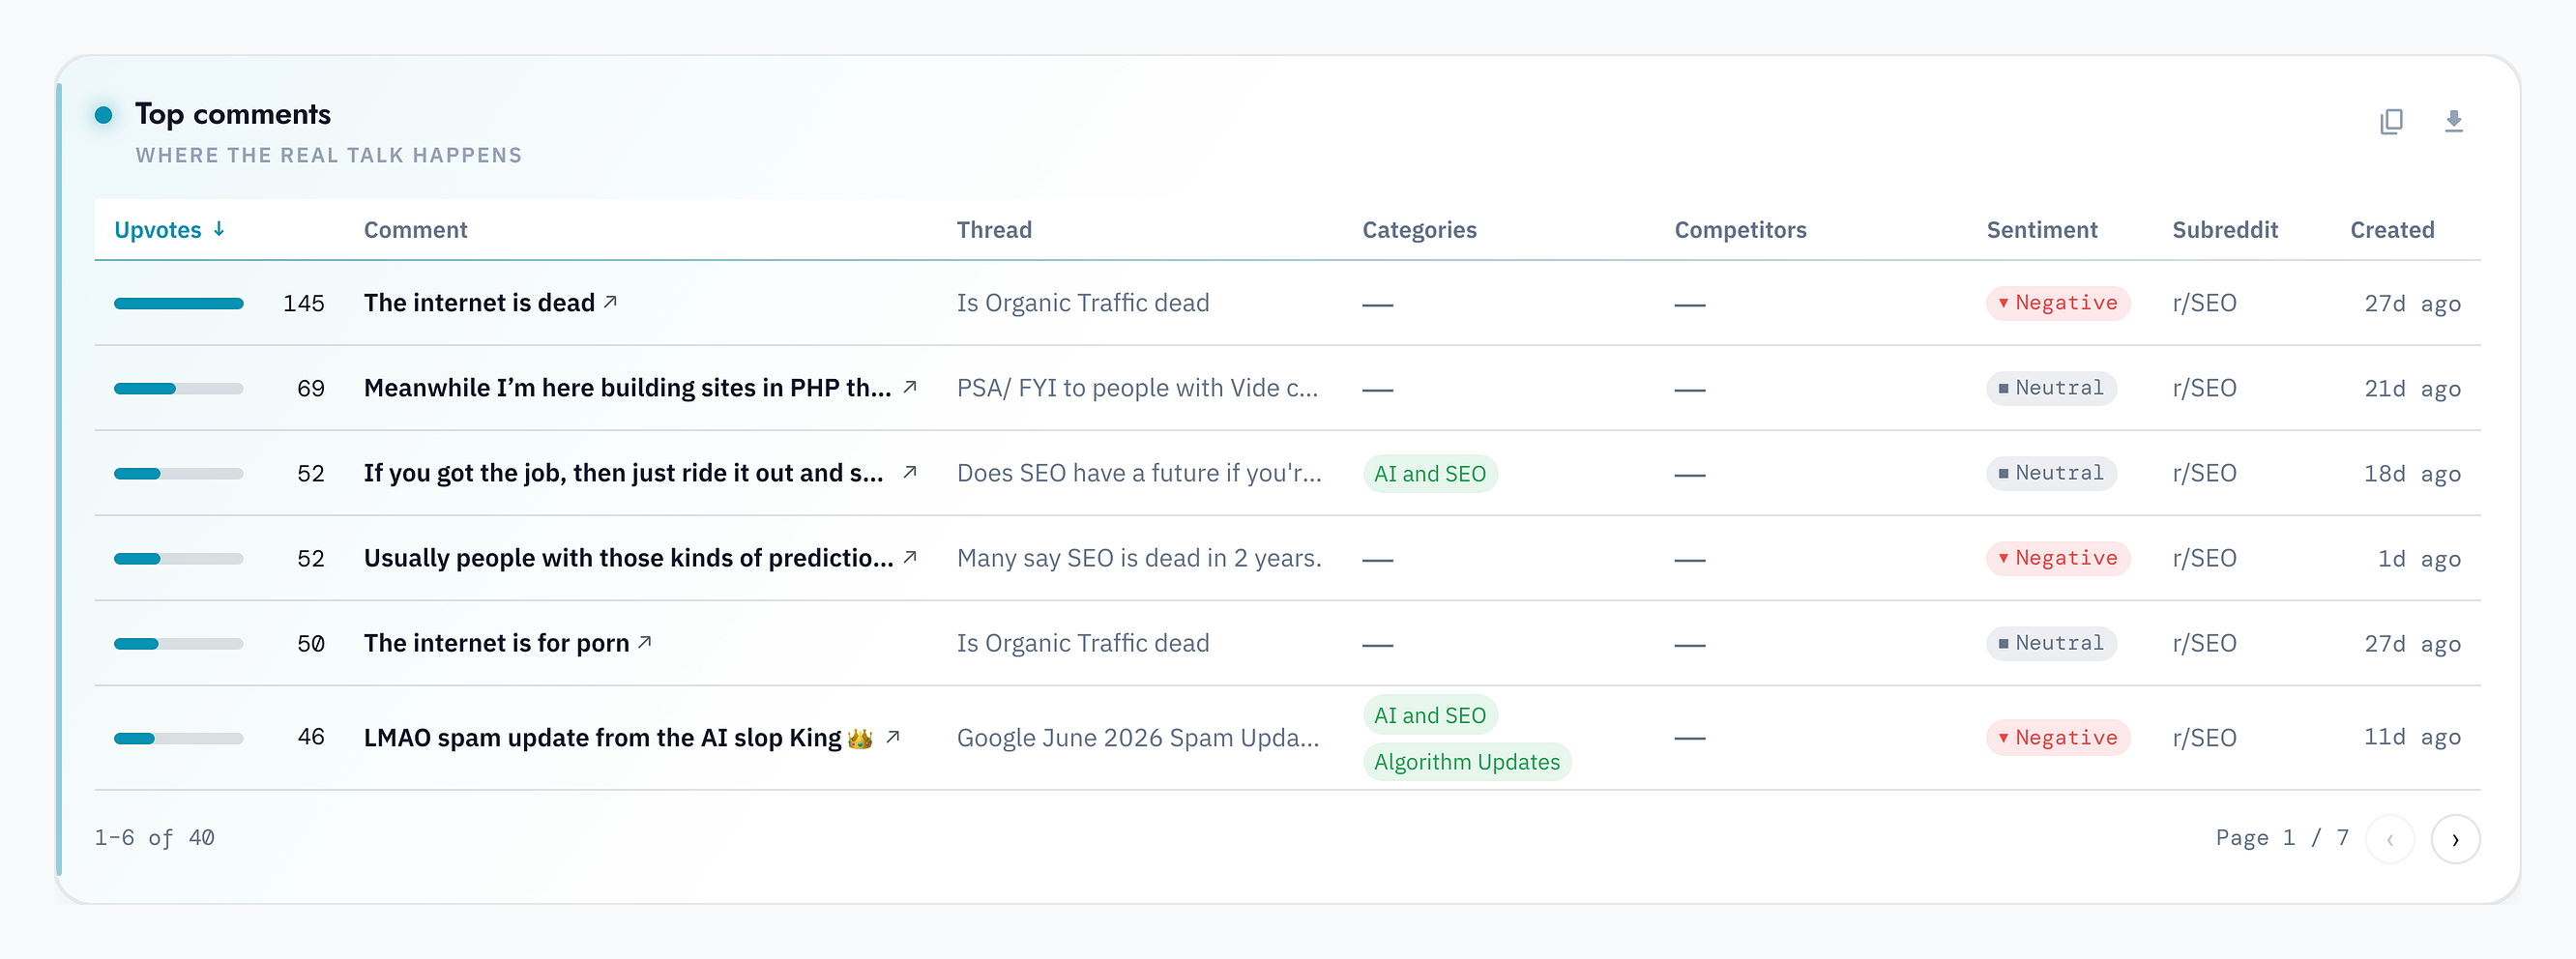
Top comments
Top comments does the same for individual replies, surfacing the standout comments inside the filtered conversations. Often the sharpest insight lives in a reply rather than the original post.
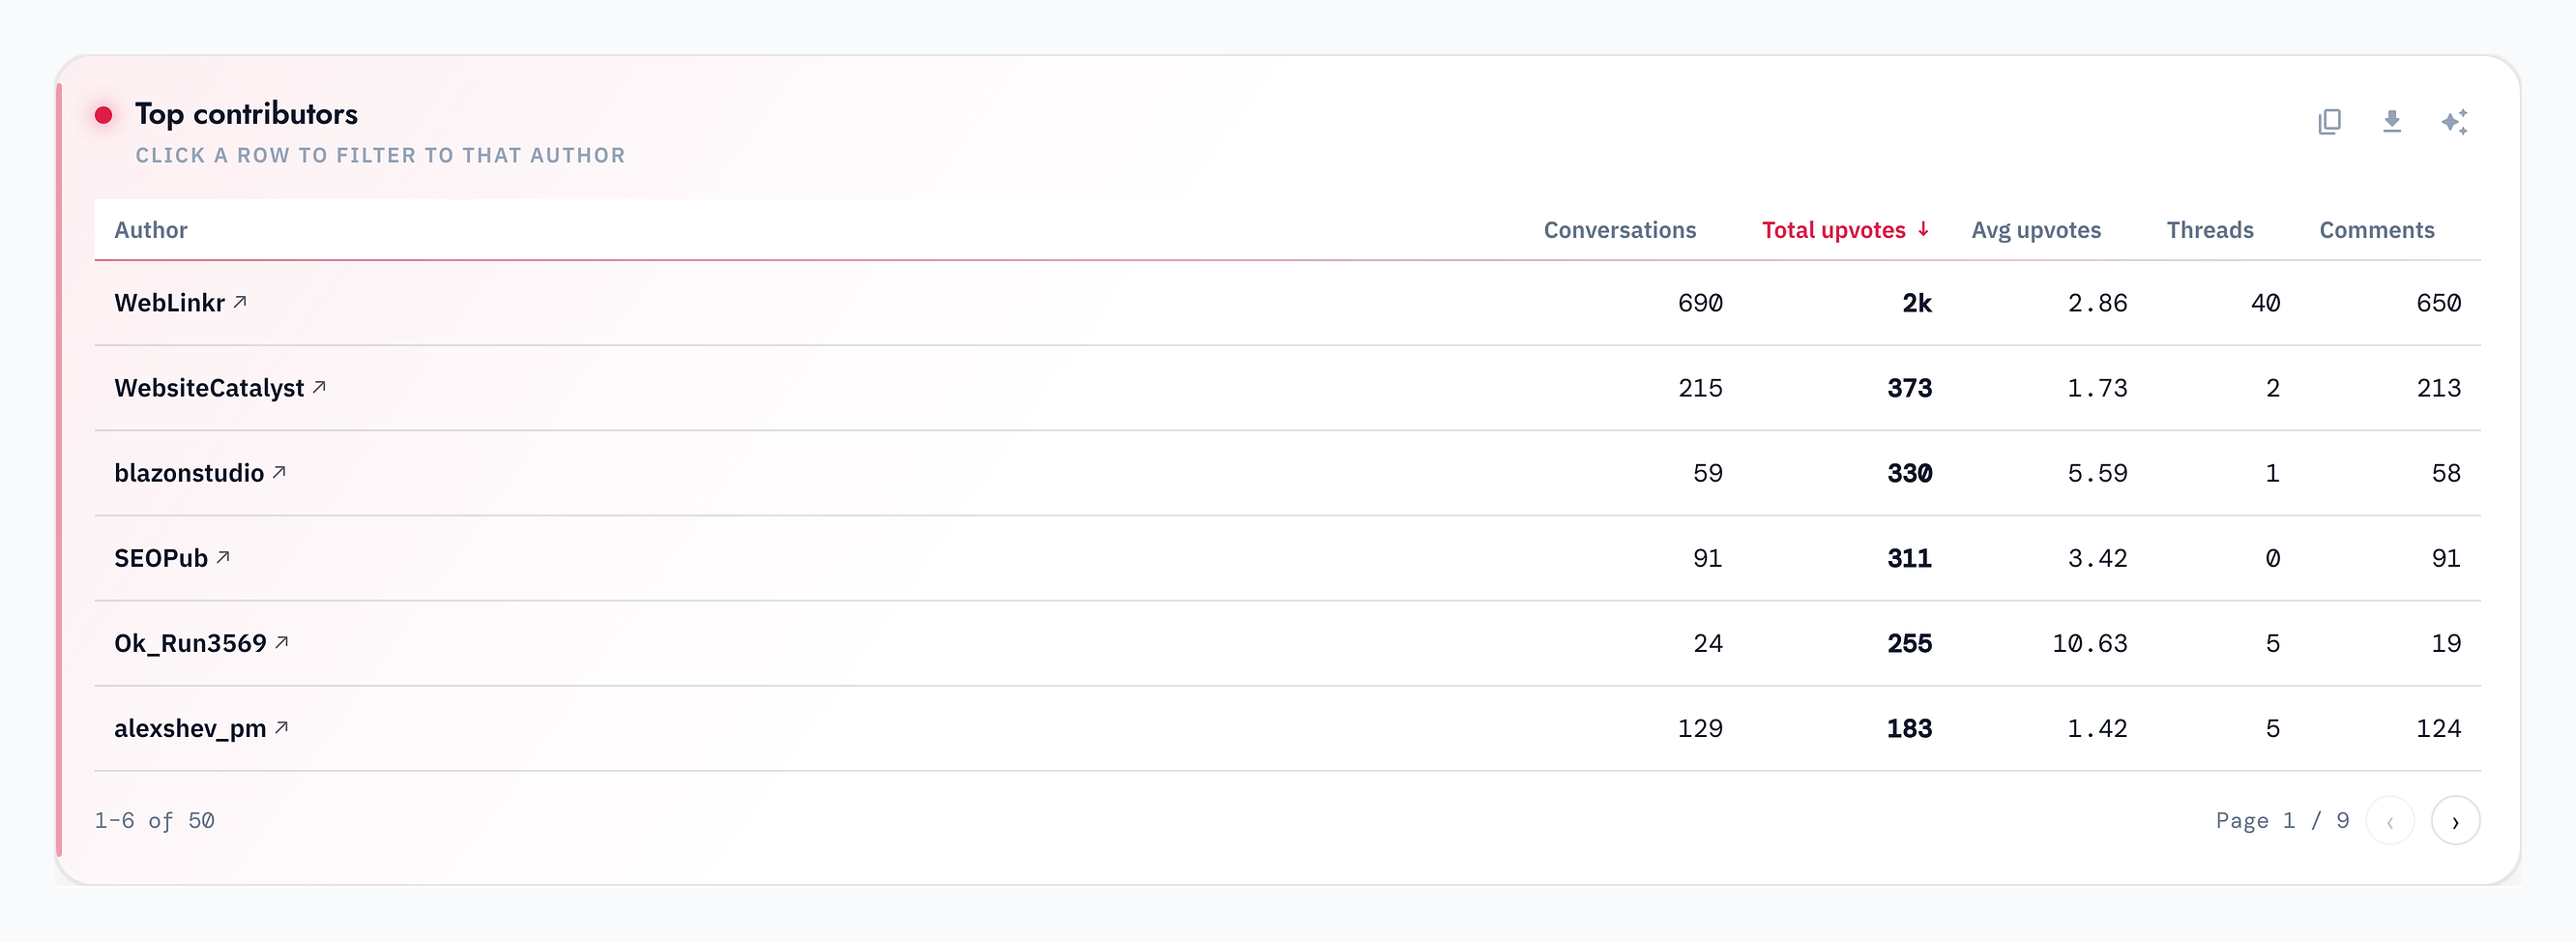
Top authors
The Top authors table shows the Reddit accounts posting most about your topics. It is a ready-made shortlist of the voices shaping your niche, useful for research, outreach or simply knowing who to follow.
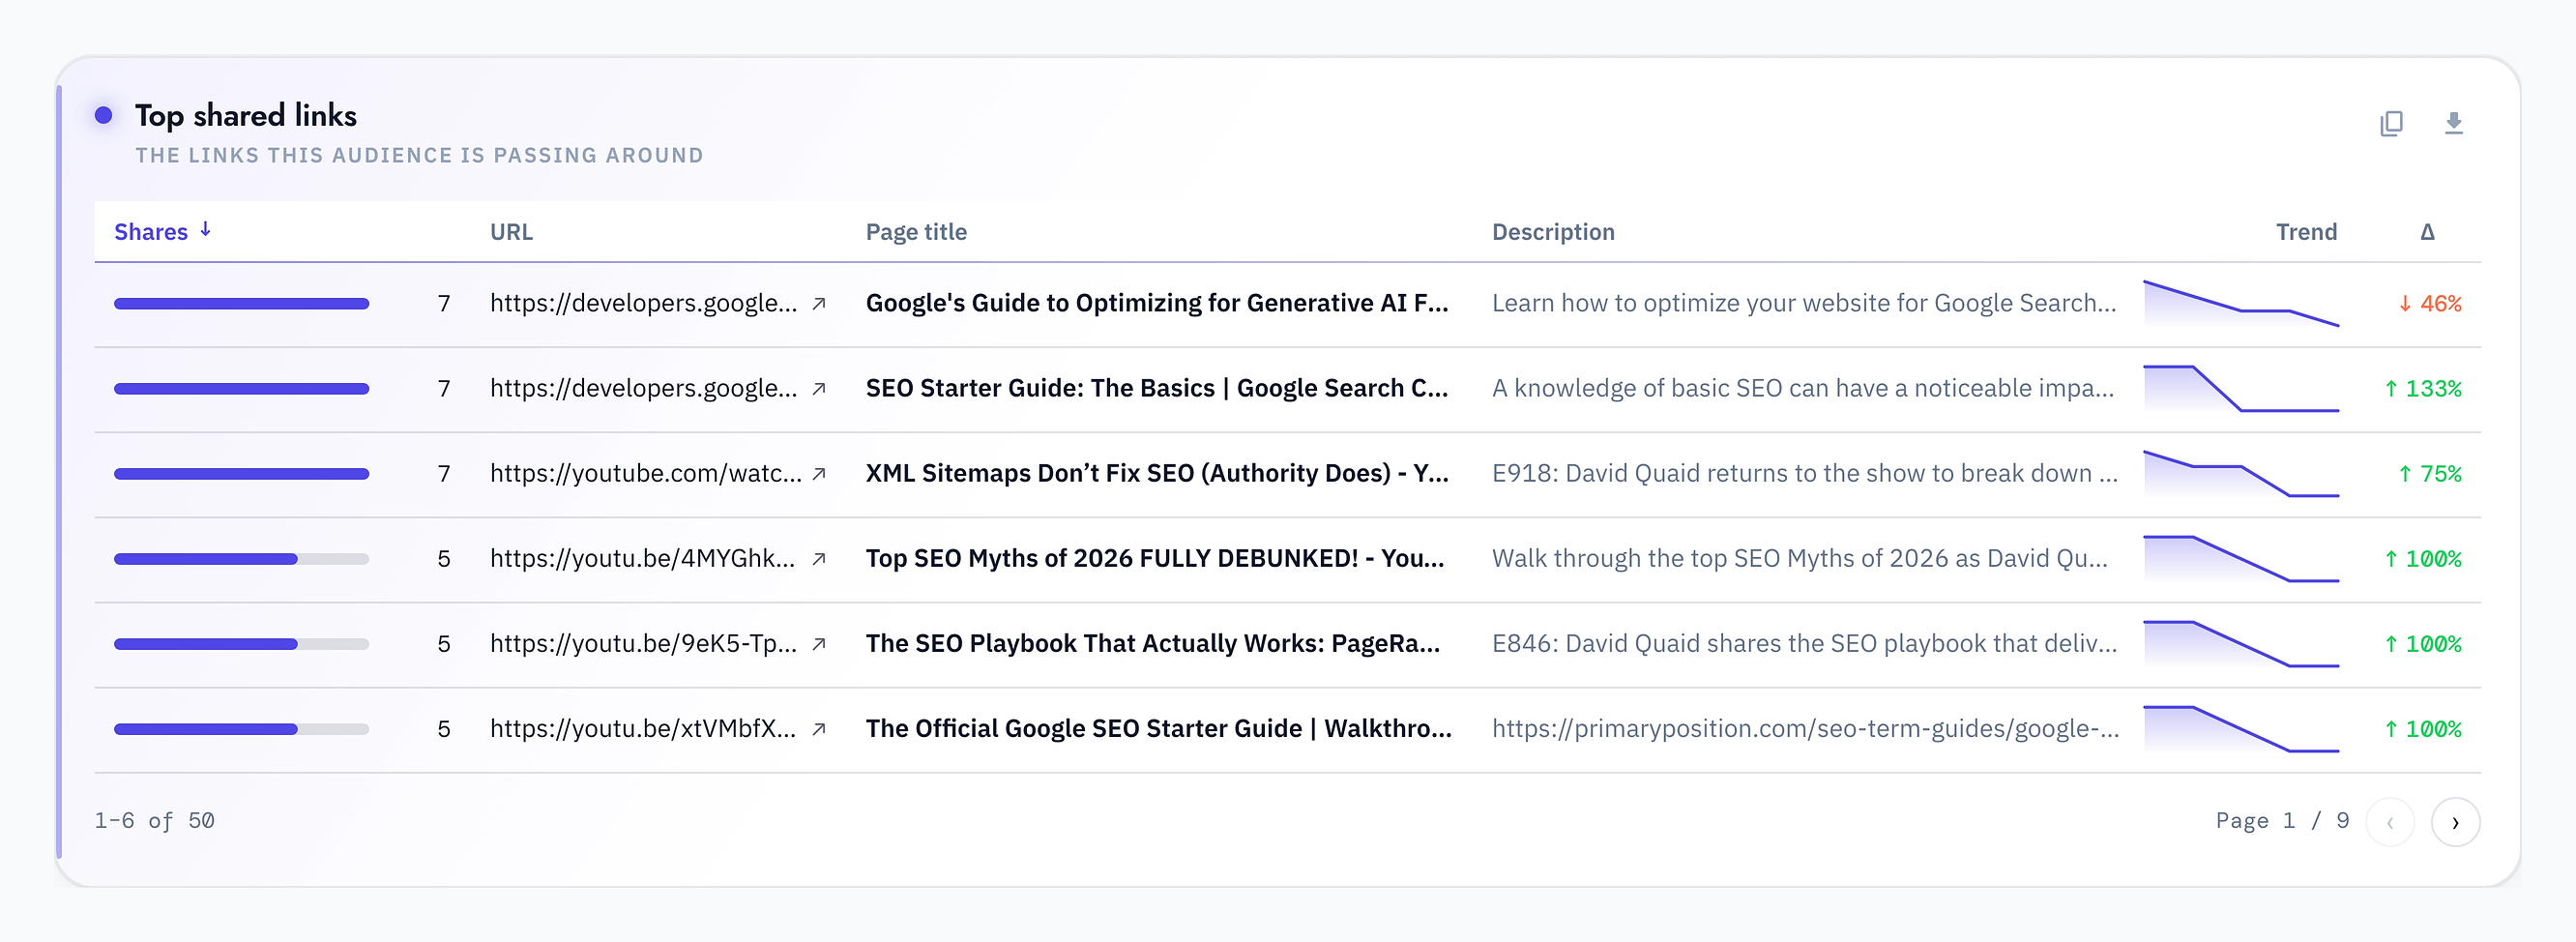
Top shared links
Top shared links lists the URLs your audience links to most often. It is a direct read on the content, tools and sources they already trust, and a strong signal for what to create or where to get mentioned.
Advanced filters
Expand the advanced panel for finer control: filter by sentiment, score, author and more. Stacking these lets you answer very precise questions, such as negative conversations about a specific competitor in the last two weeks.

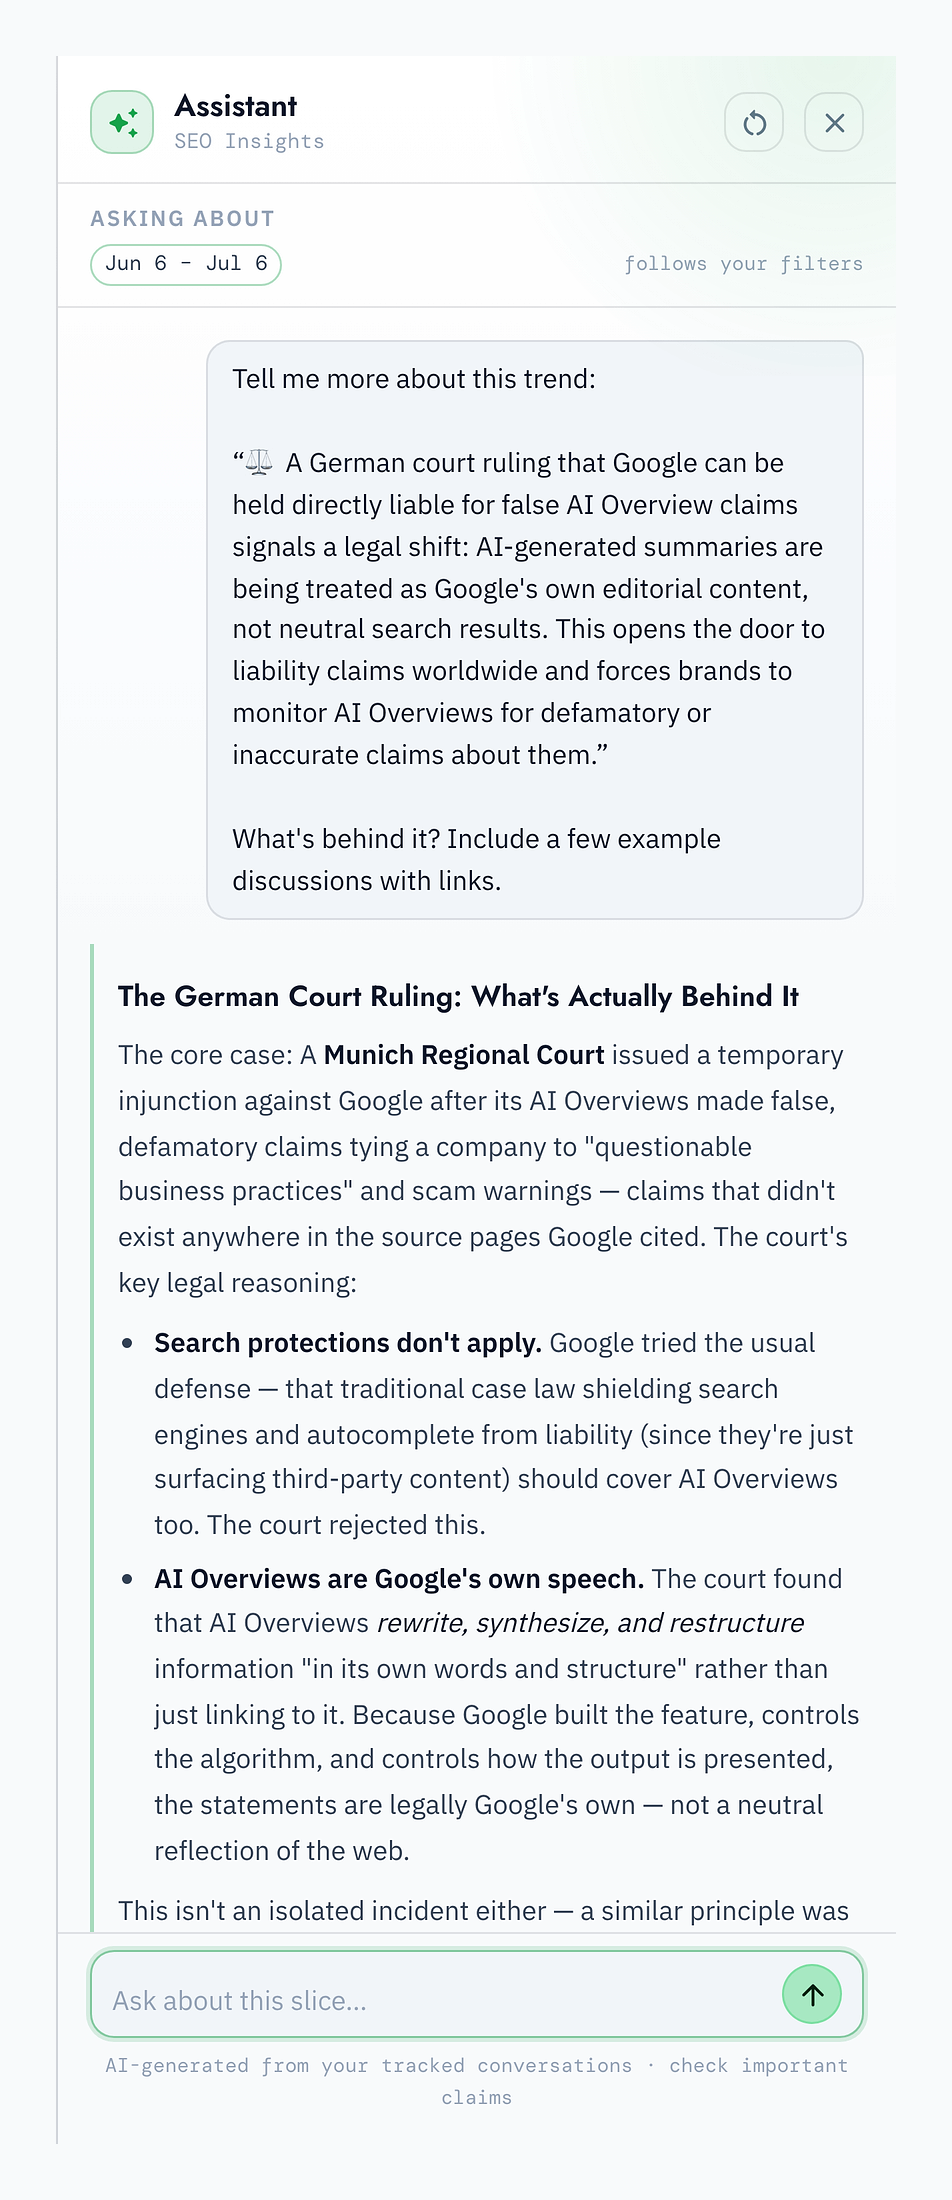
The AI Analyst
When you would rather just ask, the AI Analyst answers in plain English and analyzes the exact slice you are looking at. Ask it to summarize a trend, compare two topics, or pull example threads, and it responds with a breakdown and links you can follow.
Best practices
A few habits get the most out of Crowd Intelligence. For the full set with examples, see Best Practices for Using the Crowd Intelligence Dashboard.
Monitor regularly. Check in on a consistent rhythm so you notice shifts while they are still early.
Filter with intent. Start from a question, then stack filters until the dashboard answers exactly that.
Feed it into your content. Turn the language, topics and trends you find into briefs, posts and pages.
Watch the competition. Use the competitor and movers views to spot gaps you can own.
Engage the community. Use Top threads, comments and authors to join the conversations that matter, not just observe them.
Understanding your plan limits
Your plan sets a few boundaries. For current tiers and pricing, see Crowd Intelligence: Plans.
Data collection. How many subreddits you can monitor at once.
Monitoring capacity. How many topics and competitors you can track.
Historical analysis. How far back your dashboard can look.
If you are bumping into a limit, tightening your focus or moving up a tier restores full coverage.
Troubleshooting
Data collection seems to have stopped
If new conversations are not appearing, first check that your date range includes recent dates and that your filters are not too narrow. If the dashboard still looks stale, reach out and we will check collection on our side.
A subreddit is missing data
Very small or very new subreddits produce little to analyze, so they can look empty. If an active subreddit is missing, let us know and we will confirm it is in your collection set.
Topic classification looks off
Classification improves as the system sees more of your conversations. If a topic is consistently miscategorized, tell us during a check-in and we will tune it.
Where to go next
You now have the full picture of how Crowd Intelligence works. From here:
Understanding your dashboard metrics for a closer read of the headline numbers and charts.
Best Practices for Using the Crowd Intelligence Dashboard to turn the dashboard into a repeatable workflow.
Crowd Intelligence Setup Requirements if you are still getting set up.
Still have a question? Contact support and we will help.